Student of Non-violent Communication, researcher, trainer.
Segmentation and quantification
1. Go to “Segmentation” page in the panel on the right side of the app. It will open a page with a set of tools used during segmentation:
2. To start, check “Segment painting mode” checkbox. This will change function of right mouse click to “painting mode”.
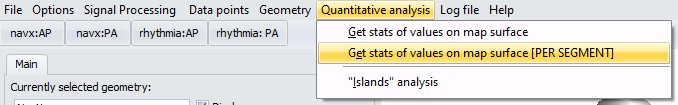
3. Once all segments are introduced, to obtain statistics of values in each segment, go to menu: “Quantitative analysis->Get stats of values on map surface [PER SEGMENT]
4. Results will be presented in a table. You can copy-paste contents of the table to excel or stats program.
4. In excel, data may be pasted into single column. Then, use excel feature “Data->Text to columns” and select delimited by comma.