Student of Non-violent Communication, researcher, trainer.
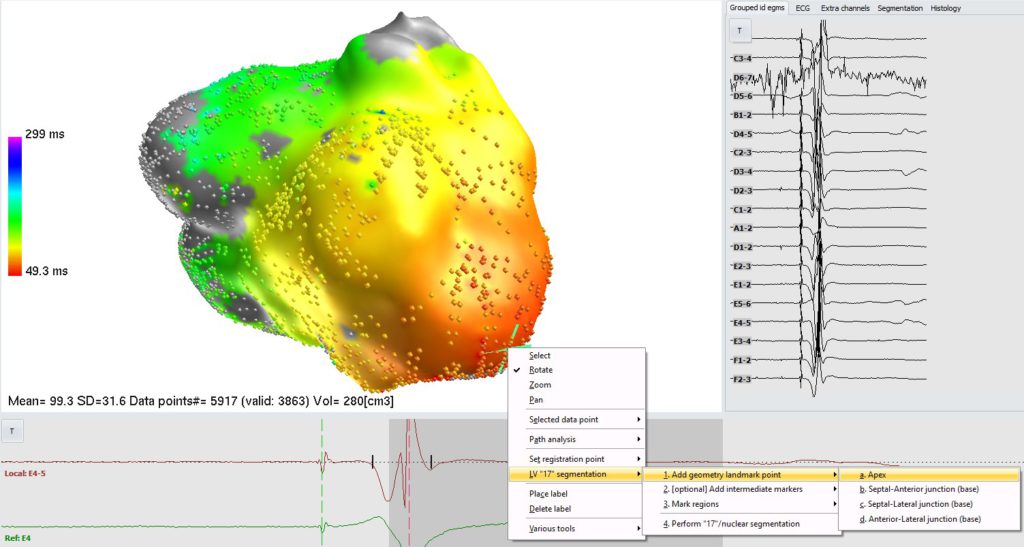
Load/import LV map. Set view projection to Anterior-Posterior (AP) view (using buttons below the manu). Put the mouse cursor on the tip of the apex, right click and select: LV “17” segmentation->1. Add next geometry landmark point->A. Apex.
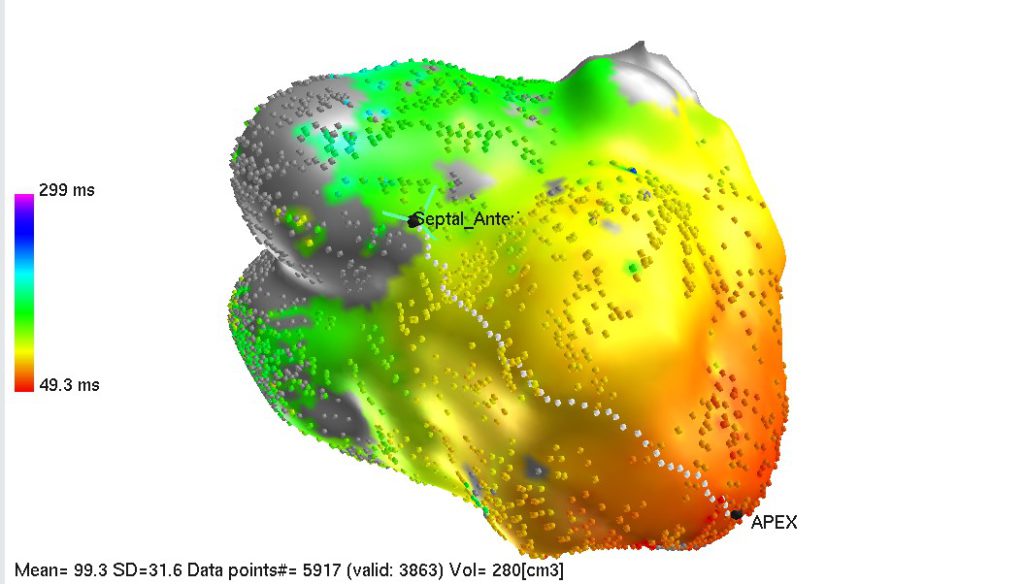
2. “Apex” marker will be placed. Then, rotate a bit and put a marker at the point at the LV base, at the border between anterior and septal segments. Right click on this point and select “LV “17” segmentation->1. Add next geometry landmark point: “b. Septal-anterior junction (base)”. A demarcation line running between this point and apex will appear:
Do the same for remaining two base landmark points:
a. Basal point between Septal and Lateral region.
b. Basal point between Anterior and Lateral region.
If you want to correct location of the landmark point, just place it again at desired location.
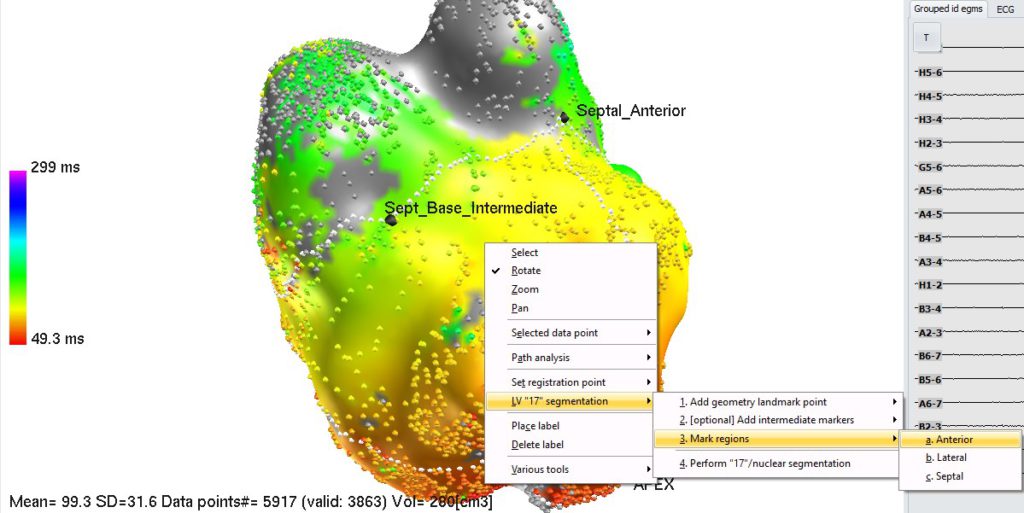
White paths joining landmark points should be rather straight. However, if geometry has complex shape, paths may meander (e.g. going around tenting areas on geometry). To counteract this effect, you can place “intermediary” landmark points. Just select the spot, right click, and select one of items from the list: LV “17” segmentation->2. [optional] Add intermediate markers->…
3. After placing all 4 landmark points, you should have LV divided into 3 equally sized regions. Now, right click on each one (any point on the region; anterior, septal and lateral) and select from menu which region you just pointed:
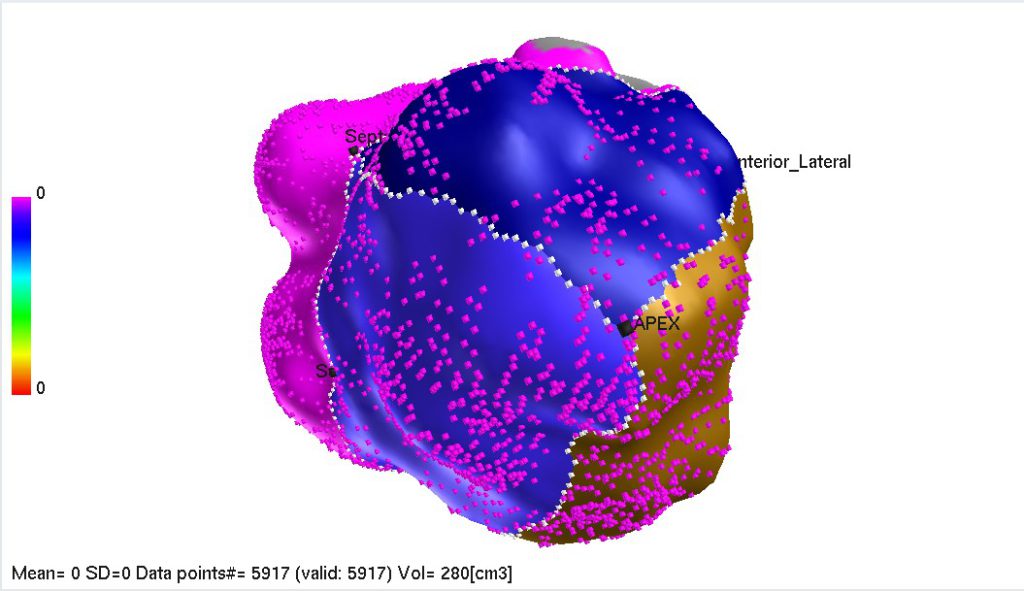
After marking all 3 segments, you can check if everything went well by selecting “Segmented areas” from “Displayed value:” selection (left upper corner of the screen). You should see all 3 segments in different colors (purple denotes not segmented area).
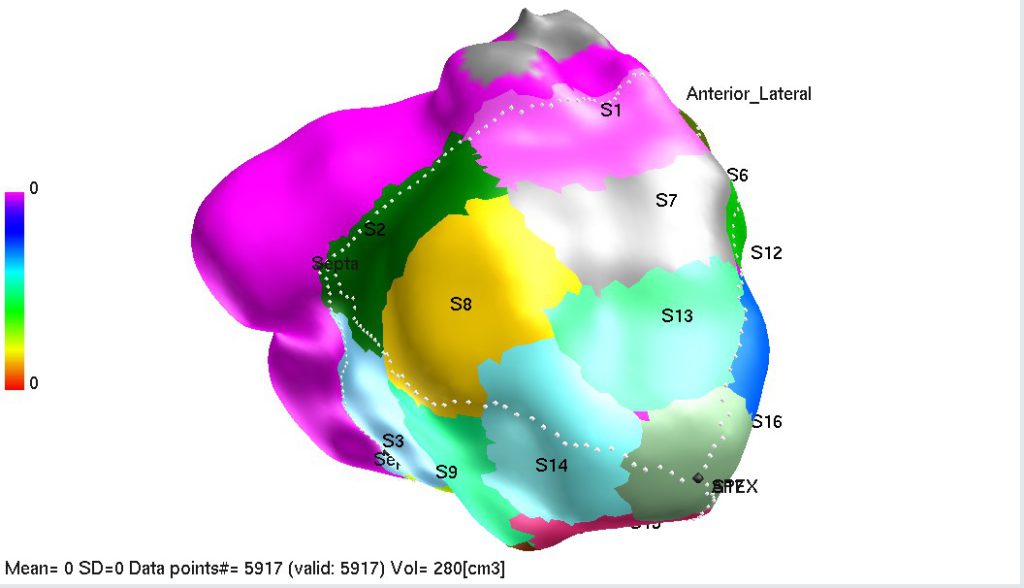
4. Last step, is initiation of automatic 17-segments marking algorithm. Right click anywhere on 3D map, and select: LV “17” segmentation->4. Perform “17”/nuclear segmentation. After a while (depending on computer power, may even take few minutes) you should see final segmentation:
To get stats in all segments, set “Displayed value” (e.g. Bipolar voltage”) and select in main menu: “Quantitative analysis->Get area …. [PER SEGMENT]”. Table will pop up with results. Tip: use one of the buttons at the bottom the window to copy all results to clipboard (and then paste straight into Excel).