Student of Non-violent Communication, researcher, trainer.
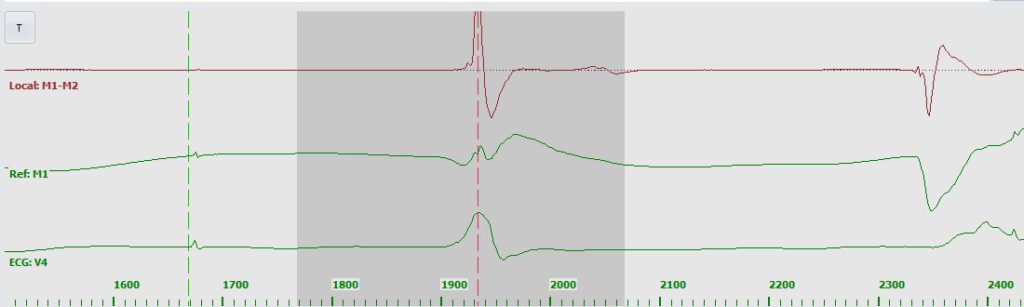
Annotation is set using two vertical sliding bars: green for reference, and red for local deflection as visible in “annotation box” at the bottom of the app window:
Both sliders can be adjusted by dragging with left mouse button.
[Note: dragging with right mouse button is used to zoom vertical scale of each egm. Just right-click in the area of the egm baseline and drag up/down.]
Sliding the red annotation bar will cause app to recalculate LAT map assigned with Local signal (differs depending on the mapping system from which data is exported). LAT value is the difference between timing of red minus timing of green bar.
AUTOMATIC ANNOTATION
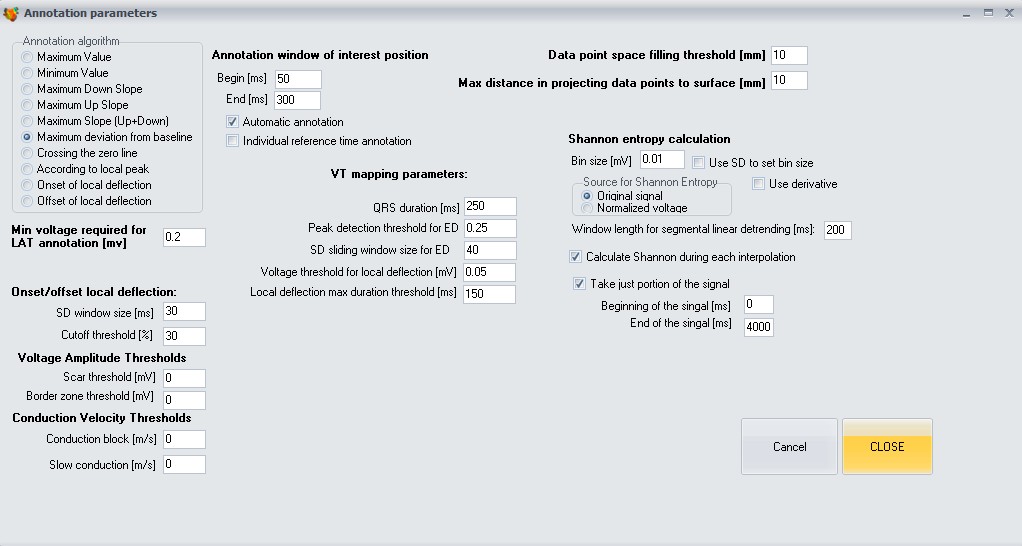
In case electrograms at all data points are synchronized in time (e.g. when analyzing signals from electrogram-grid recordings), you can use “automatic annotation” mode. To turn on this mode, go to menu: Options->Annotation/Signal processing parameters”. There are several options affecting annotation mode.
“Automatic annotation” checkbox: this will make app to automatically annotate local deflection when green bar (reference) is dragged.
“Annotation algorithm”: this is selection of various algorithms used for automatic positioning of red bar while green bar is dragged.
“Individual reference time annotation” – if checked, dragging reference bar will affect only current data point.
“Min voltage required for LAT annnotation [mV]”: only local deflections above this threshold will be included in annotation – if amplitude is below, this point will be excluded from analysis – and become gray on the map.