Student of Non-violent Communication, researcher, trainer.
Fractionation map
0. Prerequisite: properly annotated activation map. This is important because fractionation peaks are annotated around local deflection annotation (red vertical bar).
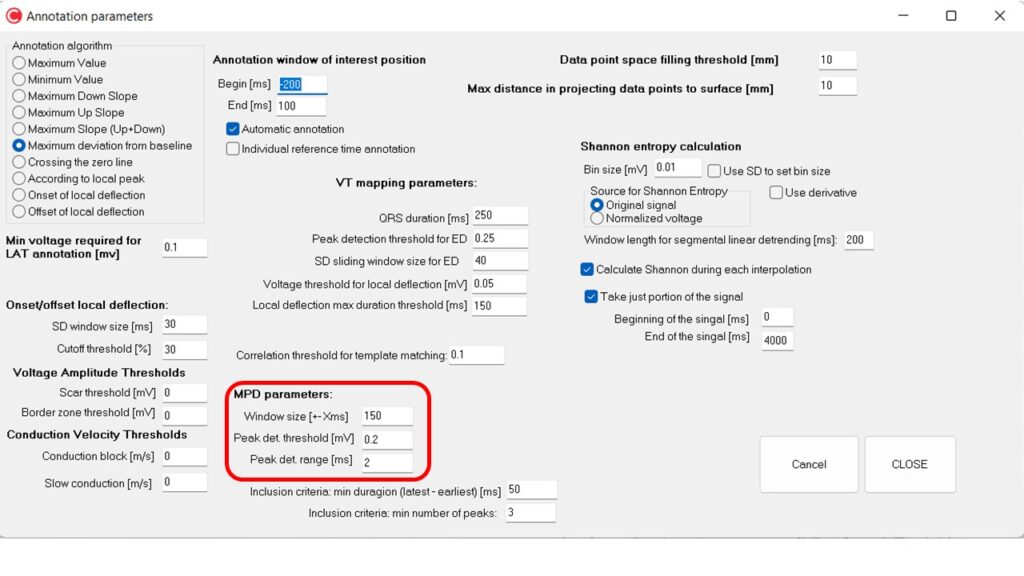
1. Set up parameters for the fractionation calculation algorithm (menu: Options->Annotation/signal processing parameters)
Window size [+-ms]: This is the window within which all fractionation peaks are annotated. By default, it is 150 ms, which means that all peaks in window of 300 ms centered around local activation are annotated.
Peak detection range [ms] (2 ms by default): this parameter controls test for the peak to be actually a peak and not single bump on more broad/complex wave (e.g. middle of W type morphology). Algorithm annotates peak if following condition is met: all values within 2 ms to the left and 2 ms to the right are below the max value of the peak (or above in case of negative direction peak).
Peak detection threshold [mV]: peak amplitude (calculated as a max-min within ‘peak detection range’ window around the peak) has to be greater than this value (or smaller than negative) in order to be annotated.
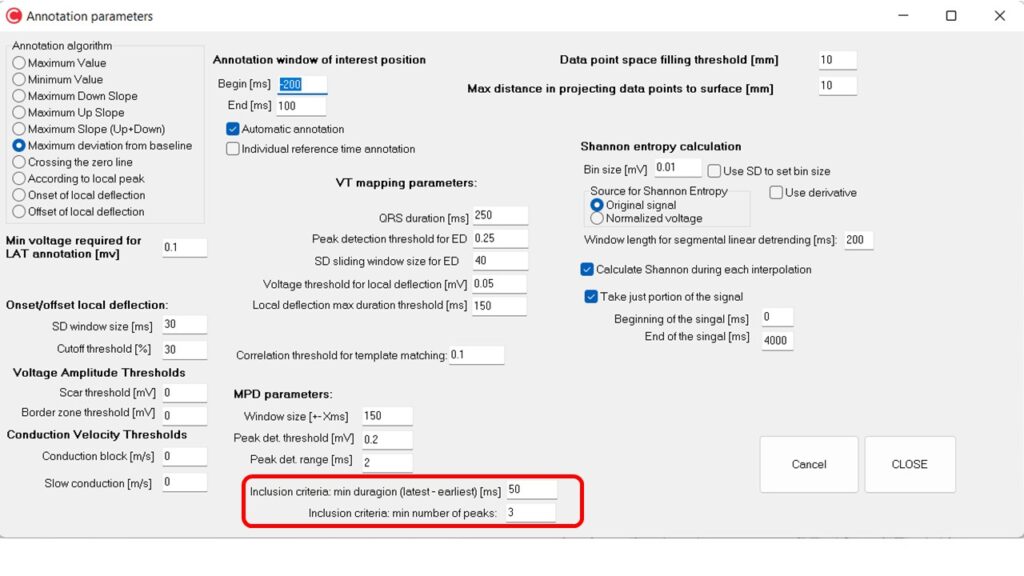
In addition, there are two parameters for inclusion of data points in the map:
Min duration (latest – earliest) [ms]: time span between last and first fractionation peak has to be greater than this threshold (default 50 ms). Min number of peaks: only cases in which there are more fractionation peaks identified than this threshold are included in map (default is 3).
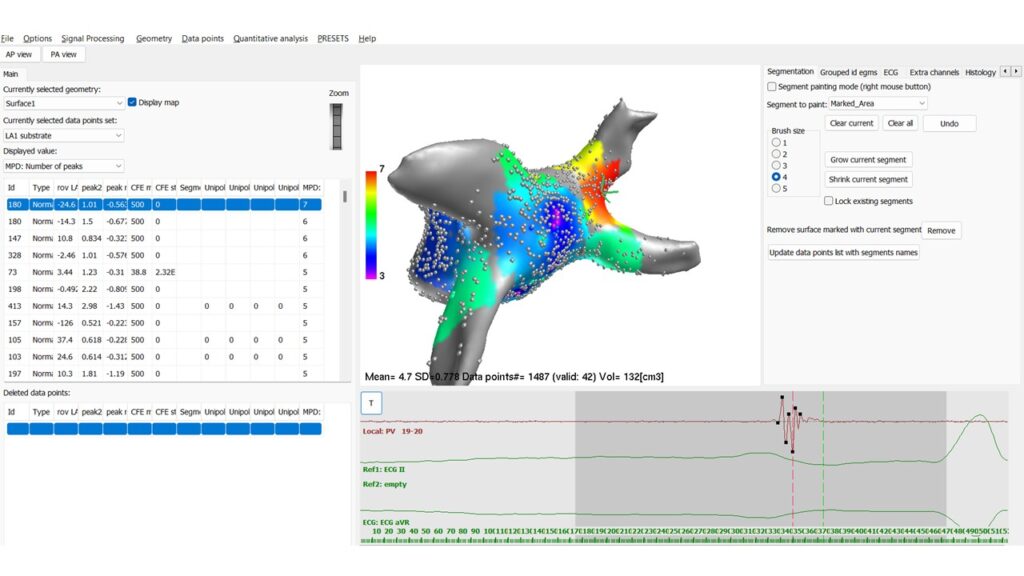
2. Once parameters are set to your liking, go to meu: “Signal processing->Calculate fractionation map (peaks around local activation). New value will be created: “MPD: Number of peaks”. Each fractionation peak will be annotated with dark rectangle marker in annotation box (bottom plot in the app).
Data points not fulfilling inclusion criteria are marked as gray and not included in color-coding of surface.